


Don’t Hate BHRs, Use Them as a Competitive Advantage


There are two things printers love to hate: budgeted hourly rates (BHRs) and the process of updating them. That’s because, too often, building BHRs turns into a months-long accounting exercise — and once the spreadsheet is “done,” it sits untouched for years while wages, leases, utilities, and volume change underneath it.
That’s the bad news. The good news is that a practical, transparent BHR model — built to be updated in minutes, not weeks — can become one of the most useful tools in your in-plant. Done right, it will help you understand true costs, price work confidently, and make smart decisions about where to compete and where to walk away.
A BHR is your annual budget translated into a “cost per hour” for each machine or department. Start by defining cost centers that match how work actually flows: an offset press, a digital press, wide-format, prepress, bindery, mailing, and so on. Keep it simple at first; you can always split cost centers later when you want more precision. Then, total the costs required to run the business for the year. At a minimum, capture these buckets:
- Direct labor (operators and helpers plus payroll taxes and benefits)
- Facility costs (rent, utilities, insurance, property taxes)
- Equipment costs (leases or depreciation plus maintenance and repairs)
- Overhead/Selling, General and Administrative (administrative and sales salaries, office expenses, software, vehicles, professional fees)
Using a full-absorption approach, every one of these dollars ultimately gets recovered through the productive hours of your cost centers.
Turning Costs into Fair Shares
Direct labor and equipment costs are typically straightforward to assign: they belong where people work and where machines sit. Overhead and SG&A require judgment — and this is where many BHR systems either become unusable or become a competitive advantage.
You can allocate overhead in several different ways:
- Equally across cost centers
- Based on direct labor dollars
- Based on machine hours
- Or you can split it into multiple “pools” (facility overhead versus admin overhead) and allocate each pool with a different driver (square footage for rent/utilities; labor dollars for admin)
The “right” choice is the method that is logical, documented, and consistent year over year.
Practical Tip #1: Build an overhead “allocation dashboard” with a single adjustment table.
Create one small table that holds your overhead allocation percentages for each cost center. Then allocate overhead by multiplying total overhead dollars by the percentages; traditionally, we use the shop’s physical space as the percentage factor (.20 for printing, .35 for finishing, etc.). If you want, you should compare the “space” versus “equal share” to my favorite, “shift more overhead toward busier areas,” to support competitive pricing. This will allow you to change one table, and the entire model will update.
From Available Hours to Productive Hours
The other side of the BHR equation is time. Start with the annual available hours: the hours the shop is open each week, multiplied by 52, minus holidays and planned shutdowns. Then subtract the real-world nonproductive time: sick days, meetings, training, and administrative tasks. What remains is theoretical production time.
No machine runs 100% of the time. To reflect setups, changeovers, waiting for approvals, and normal scheduling gaps, most printers apply a utilization factor — often 70% to 80% — to convert available hours into productive hours. For digital devices, you can tighten accuracy by basing productive hours on actual impression volumes and rated speeds (especially when speed varies by sheet size).
Practical Tip #2: Add “proof of hours” with a lightweight time-and-volume sanity check.
Even if you don’t have a full MIS, add a simple annual check that compares your assumed productive hours to reality: pull a month of run logs (or even estimates/production tickets), total the machine hours you actually billed or tracked, and annualize it. If your model assumes 1,600 productive press hours but your shop historically only produces 1,100, your BHR will be understated, and you’ll under-recover costs. If your model assumes too few hours, your BHR will spike and you’ll price yourself out of the market. This one check prevents the most common BHR failure: a denominator built on hope.
Arriving at the Budgeted Hourly Rate
With total annual cost per cost center and productive hours per cost center, the math is simple:
BHR = Total Annual Cost for the Cost Center ÷ Productive Hours for the Cost Center
Some shops treat BHR as a pure cost rate and add profit as a markup at the estimated time. Others multiply the cost-based BHR by (1 + target margin) to create a charge rate. Either works — as long as you are clear whether the rate is a break-even or selling rate, and you apply it consistently.
Build a Spreadsheet You’ll Actually Update
The practical secret to BHRs is spreadsheet design. Build the model so annual updates are routine, not disruptive. Separate inputs from formulas. Keep key inputs adjustable: staffing counts by department, wages/salaries by role, burden rate, rent, utilities, insurance, equipment lease/service costs, utilization assumptions, and discretionary lines. To reduce the BHR for a machine that has been paid off, you simply remove or reduce the annual “ownership cost” that you were charging to that cost center.
In practical terms, that means setting the lease or loan payment line to zero (or removing whatever depreciation or financing-recovery amount you were using in your model), while keeping the ongoing costs that still exist — such as maintenance and service contracts, insurance or property tax, and the machine’s share of facility and overhead. Once the payment is gone, the total annual cost assigned to that cost center drops, and when you divide that lower annual cost by the same productive hours, the BHR decreases accordingly.
The main caution is that if you were effectively using the payment line as a way to fund future replacement, eliminating it will lower the BHR but also remove that built-in replacement funding; in that case, a practical compromise is to reduce the line rather than delete it entirely by substituting a smaller “replacement reserve” amount.
Drive allocations using percentages (not hard-coded dollar pushes). And include a small section that shows BHRs at multiple utilization levels (60%, 75%, 90%, 100%) so you can see volume risk immediately.
Calibrating Your BHRs to the Market
Once your model calculates BHRs, don’t stop at the math. You need a competitive lens. Compare your resulting prices (based on BHRs plus materials) against local quotes, historical prices you’ve successfully sold at, and any industry benchmarks you trust. If your model produces pricing consistently higher than the market, investigate the causes: low utilization assumptions, heavy discretionary overhead loads, or margins that don’t fit the work type. If you’re consistently below market, you may be under-recovering overhead or leaving margin on the table.
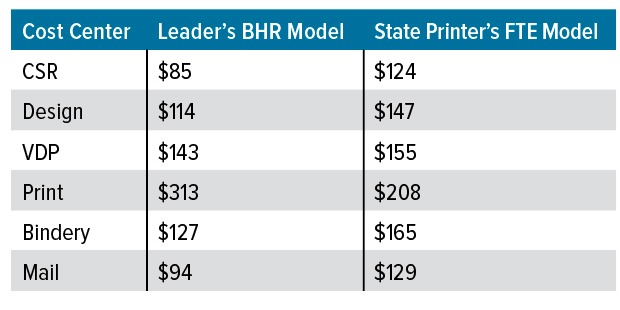
Below is a table created for a state printing operation showing the difference between its calculated BHRs, in which the printer allocated overhead based on FTEs (full time employees), and a business leader’s BHR based on the volume of work. The state printer model uses FTEs, while the leader’s model allocates more overhead to the busiest area, such as printing.
Click to enlarge.
As you can see, the state printer’s FTE model results in higher rates for CSRs, design, VDP, bindery, and mail, and lower rates for printing. This explains why the printer sold transactional printing successfully, but was losing bids on commercial jobs that required bindery work.
Practical Tip #3: Create a “Test Jobs” tab and adjust allocations last, not first.
Build a small tab with between three and five representative jobs (short-run digital, longer-run offset, a bindery-heavy job, etc.). Enter hours by cost center, pull BHRs automatically from the model, add materials, and compare your calculated selling price to competitive quotes. Use this tab to guide decisions in the right order:
- Confirm costs and productive hours are realistic
- Confirm overhead/discretionary choices are intentional
- Then adjust the margin strategy by work type to land competitively where you choose to compete. This prevents the common mistake of “fixing” competitiveness by distorting the cost model
A Value-Added Tool, Not a Punishment
According to Andy Papparozzi, chief economist of PRINTING United Alliance, leading companies know their prices to the penny. That only comes from hyper-accurate BHRs.
Budgeted hourly rates are more than an accounting exercise. When they include thoughtful allocation of mandatory and discretionary costs, realistic productive hours, and a built-in competitive check, they turn your budget into usable pricing intelligence. Build the spreadsheet so inputs are adjustable, allocations are transparent, and results can be tested against real work and real quotes. Do that and BHRs stop being something you hate and start becoming one of the most practical tools you use to price smarter and compete on purpose.
- Categories:
- Business Management - Finance/Financial
Howie Fenton is an independent consultant who focuses on analyzing/benchmarking the performance of printing operations. Fenton helps companies use metrics, best practices and workflow strategies to streamline operations. Call (720) 872-6339 or email howie@howiefentonconsulting.com


